Warrior Met Coal Analysis

Business Overview
Warrior Met Coal is a leading producer of High Vol A metallurgical coal, a critical input in steelmaking. Headquartered in Alabama, the company was spun off from the now-defunct Walter Energy, acquiring Mines No. 4 and No. 7, along with coal-washing infrastructure, at no cost. Today, Warrior Met Coal operates three mines—Mines No. 4, No. 7, and Blue Creek—and is renowned for its exceptionally low production costs, one of the strongest competitive advantages in the commodities industry. With cost efficiency as its primary moat, Warrior stands among the most cost-competitive metallurgical coal producers globally, rivaled only by a few major players such as BHP and Mitsui.
Understanding The Met Coal Demand
Metallurgical (met) coal is heated to create coke, which then serves as a fuel, reducing agent, and structural support in the blast furnace. Inside the furnace, the coke burns to produce carbon monoxide and the high temperatures necessary to convert iron ore into molten iron. This molten “pig iron” is then tapped and sent to a steel shop for further processing into steel. Met coal is a factor of production of steel with approximately 770 kg of coal needed to make one ton of steel. However due to ESG concerns, countries have been slowly transitioning from blast furnaces to electric arc furnaces instead which do not need met coal to produce steel. Electric Arc Furnaces (EAFs) produce steel by melting scrap metal and other iron-bearing materials using the high heat generated from a powerful electric arc between graphite electrodes and the metal charge. The EAF operates in a batch process, with steps including charging the furnace with scrap, creating the electric arc to melt it into a liquid bath, refining the molten metal to adjust its chemistry, and finally tapping the molten steel for casting. This method relies on electricity to melt recycled steel, making it a key part of low-carbon steel production by avoiding the need for raw materials like iron ore and coal.
Despite the transition to EAFs, the Metallurgical Coal Market Industry is expected to grow from 68.52(USD Billion) in 2023 to 89.0 (USD Billion) by 2032. The Metallurgical Coal Market CAGR (growth rate) is expected to be around 2.95% during the forecast period (2024 - 2032).
This growth is largely driven by an increase in demand of met coal due to infrastructure buildout in India as well as new blast furnaces that are coming online in the next few years in the SEA market (Fig1.1). SEA and India are not able to utilise EAFs due to 2 different reasons:
EAFs require a steady supply of recycled steel which is not prevalent in SEAI
EAFs require a stable and large electrical grid infrastructure
WIth large capex spent on BFs one can expect a steady demand of met coal in the region with the average BF lasting around 40 years before it is decommissioned.
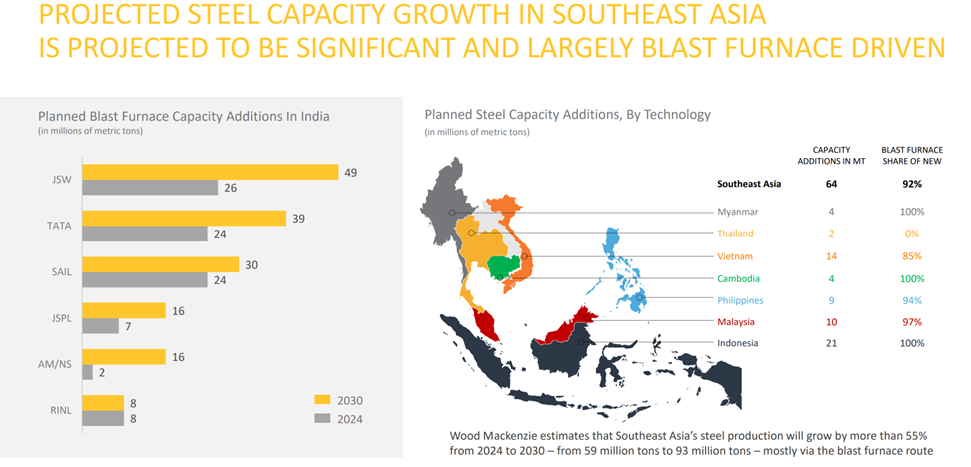
Fig1.1
In general there are 4 main types of met coal:
Coking Coal
Hard Coking Coal (HCC)
Semi-soft Coking Coal (SSCC)
Pulverized Coal Injection (PCI) Coal
I will be focusing on HCC which is the highest quality coal as well as the most environmentally friendly coking coal due to its low sulfur and ash content. Countries are transitioning from PCI SSCC and Coking Coal to HCC to meet ESG criterias.
Understanding Warrior Met Coal’s Moat
Warrior has a combination of 3 moats that make its business highly profitable & coupled by the lack of interest in the coal mining space by institutions, it has created a decent opportunity for individual investors.
1) Irreplicable FOB costs
To unpack this we have to first understand what FOB costs are. FOB (full on board) costs are costs that are borne by the miners in the production of coal. These are Mining Costs (50%), Transportation Costs (35%) as well as Royalties (15%). Miners are responsible for transporting the coal to the nearest ports and transportation costs make up a bulk of their FOB costs as coal is bulky to transport.
Warrior Met Coal’s FOB costs are low due to 2 different factors: Transportation Costs as well as Mining Costs.
Transportation Costs
Warrior is located in close proximity to the Port of Mobile compared to its other peers in the US (400 miles on average) as well as its major competitors in Australia (350 miles).
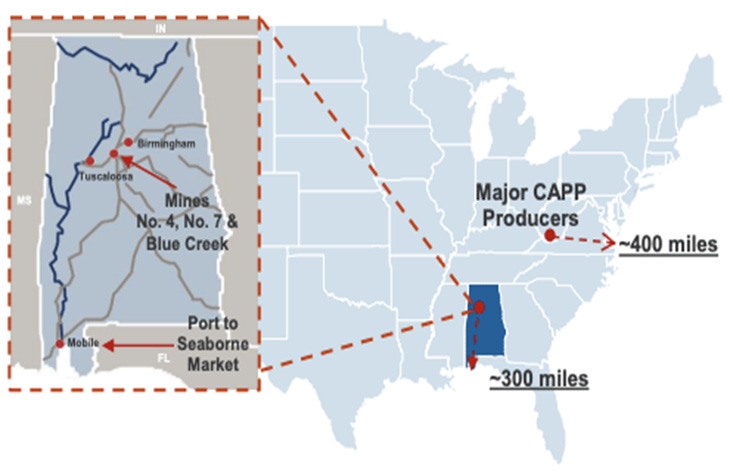
Shorter distances to the ports enable warrior met coal to have a lower transportation cost compared to its peers. However this is not the biggest reason why transportation costs are so low for Warrior.
The vast majority of export-bound met coal, particularly in the US and Australia, is moved long distances from the mine to the port via rail. In many key producing regions, the infrastructure is a near-monopoly or duopoly:
United States (Appalachia): Met coal producers in the Appalachian Basin (West Virginia, Virginia, Pennsylvania) are primarily served by just two major Class I railroads: CSX and Norfolk Southern. A specific mine’s location often determines which of the two—or occasionally a short line that connects to just one of the majors—is its only feasible option for long-haul transport to a coastal port.
Australia (Queensland & New South Wales): Similarly, in the world’s largest met coal exporting country, the major coal regions rely on dedicated rail networks and a limited number of port terminals. For example, in Queensland, access to ports like Dalrymple Bay or Hay Point is controlled by a few rail operators and terminal owners, creating a chokepoint.
However, due to the unique geographical location of Warrior, it can have access to multiple transportation options other than rail- it has access to barges as well. This access to the barge is the main reason for the low cost of transportation for the company compared to its competitors. Barges are large, flat-bottomed boats used to carry heavy goods on rivers, canals, and other inland waterways. Think of them like floating platforms or giant containers that move slowly across the water (saving significantly on fuel costs as the river is flowing downstream in the direction of the Port Of Mobile).
The coal is transported via the Black Warrior-Tombigbee Waterway system. This system connects the area near Warrior Met Coal’s mines in west-central Alabama (Tuscaloosa/Brookwood area) to the coast. The company has invested in its own infrastructure to enable river transport. This includes building or operating barge loadout docks/terminals near its mine sites (Mine 4, Mine 7, and a new one for the Blue Creek expansion) to transfer coal from its preparation plants or rail loadouts directly onto river barges.
Inland waterway transport is a low-cost option for moving bulk commodities like coal, helping Warrior Met maintain its competitive position as a low-cost producer. The presence of alternatives to rails also enables higher bargaining power with rail producers which effectively lowers the FOB costs of Warrior Met Coal. In fact, Port of Mobile reports that at times, over half of the export coal arrives by river. This unique geography is irreplicable at other mines across the world due to geographical limitations (no one can determine/change where their mines are located). This geographical advantage enables Warrior to enjoy close to 40% less transportation costs compared to its counterparts.
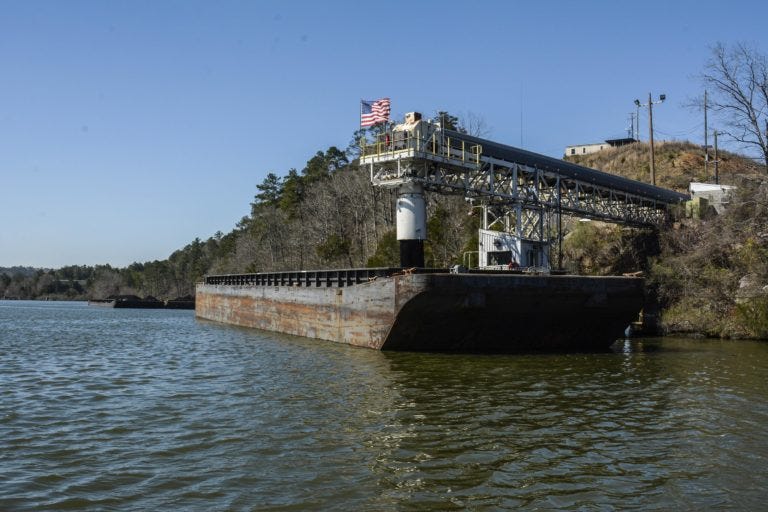
Warrior met coal barge system for the newly developed blue creek mine
Low Mining Costs
Warrior Met Coal operates in the Blue Creek and Brookwood coal seams in Alabama, which are known for producing premium quality metallurgical coal (specifically Premium Low-Volatile and High-Volatile A) that has very low sulfur and strong coking properties.
The company uses highly efficient underground longwall mining systems in its operations. Longwall mining is a high-volume, continuous mining method that typically has lower per-ton costs compared to room-and-pillar or surface mining, especially for deposits with large, consistent seams. These longwall mining systems enable them to lower their costs significantly compared to their competitors who use a blend of longwall and pillar mining. Competitors are not willing to swap to longwall mining due to the immense sunk costs that they have for installing their pillar mining facilities. Fortunately, since warrior is a relatively new mine & have always utilised longwall mining, they do not have sunk costs involved in switching mining systems.
Warrior Met Coal has a variable cost structure that allows its costs to adjust somewhat with the benchmark metallurgical coal prices, providing financial flexibility and helping to protect margins during market downturns. Their labour costs are tied to the SPGI Platts Index. The labour costs are capped at the upside, enabling warrior met coal to have relatively low FOB costs even during coal booms.
Royalties
Royalties are money that are to be paid to the owners of the land that the mines are mining on and these are subject to heavy regulation. One of the benefits of the coal mines in the US are the fact that the state & government are generally pro coal compared to the Australian government which imposes a large tax % on their coal mines (up to 40% when the coal prices are above $400USD/Tonne). However, in the US Trump’s BBB will provide a tailwind to the business. The bill includes a 2.5% tax reduction for met coal mining companies in the US. The bill also slashes the royalties that coal companies must pay to the federal government for mining on public lands, further lowering operational costs for producers. This places US met coal mining companies at a better advantage on the global scale as it enables them to be more price competitive.
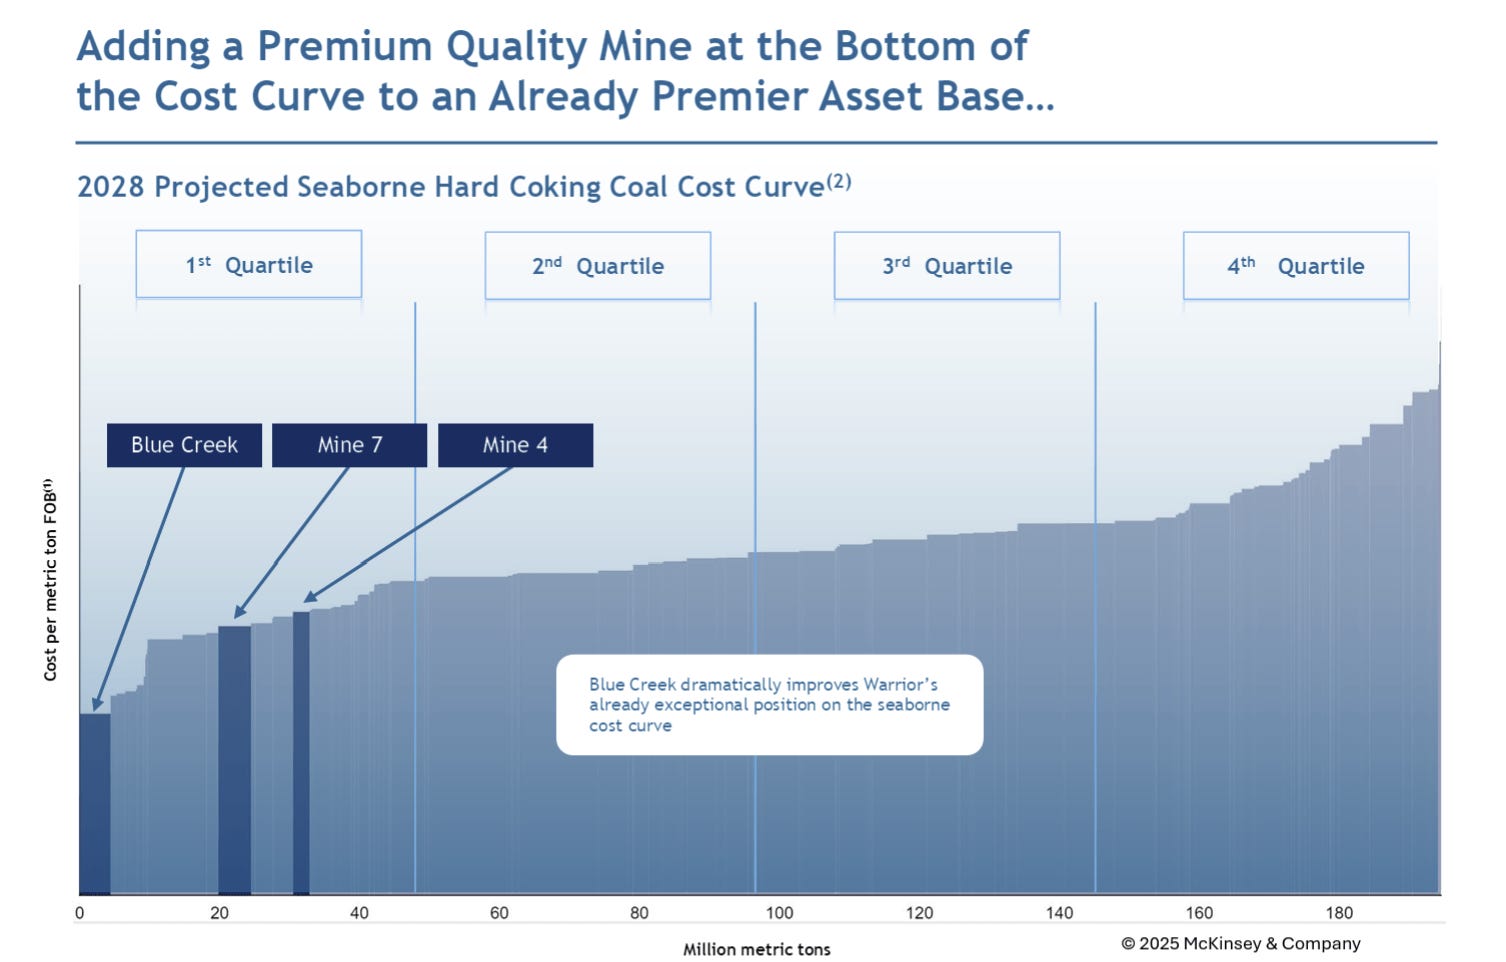
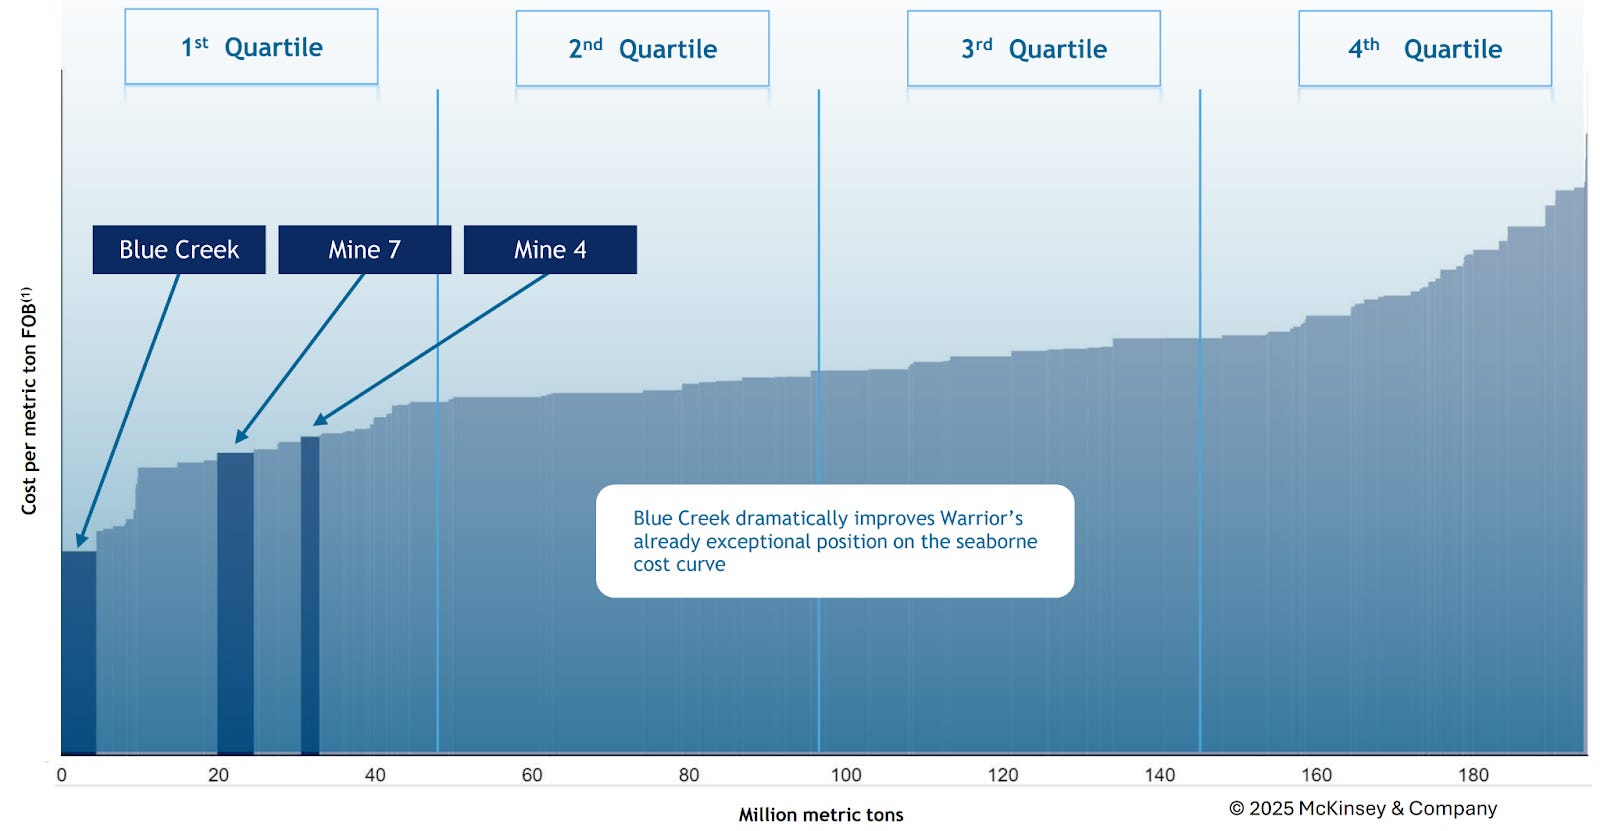
A combination of these 3 factors enables warrior met coal to have irreplicable cost advantages that enables them to have a significantly low FOB costs which enable them to be profitable even in the toughest of times compared to other competitors such as AMR that have an FOB cost of 120USD/St compared to Warrior’s 95USD/St when blue creek is in full production. These low FOB costs enable the company to generate significant cash flows and remain profitable even in the worst conditions (i.e. met coal price downturn during Covid).
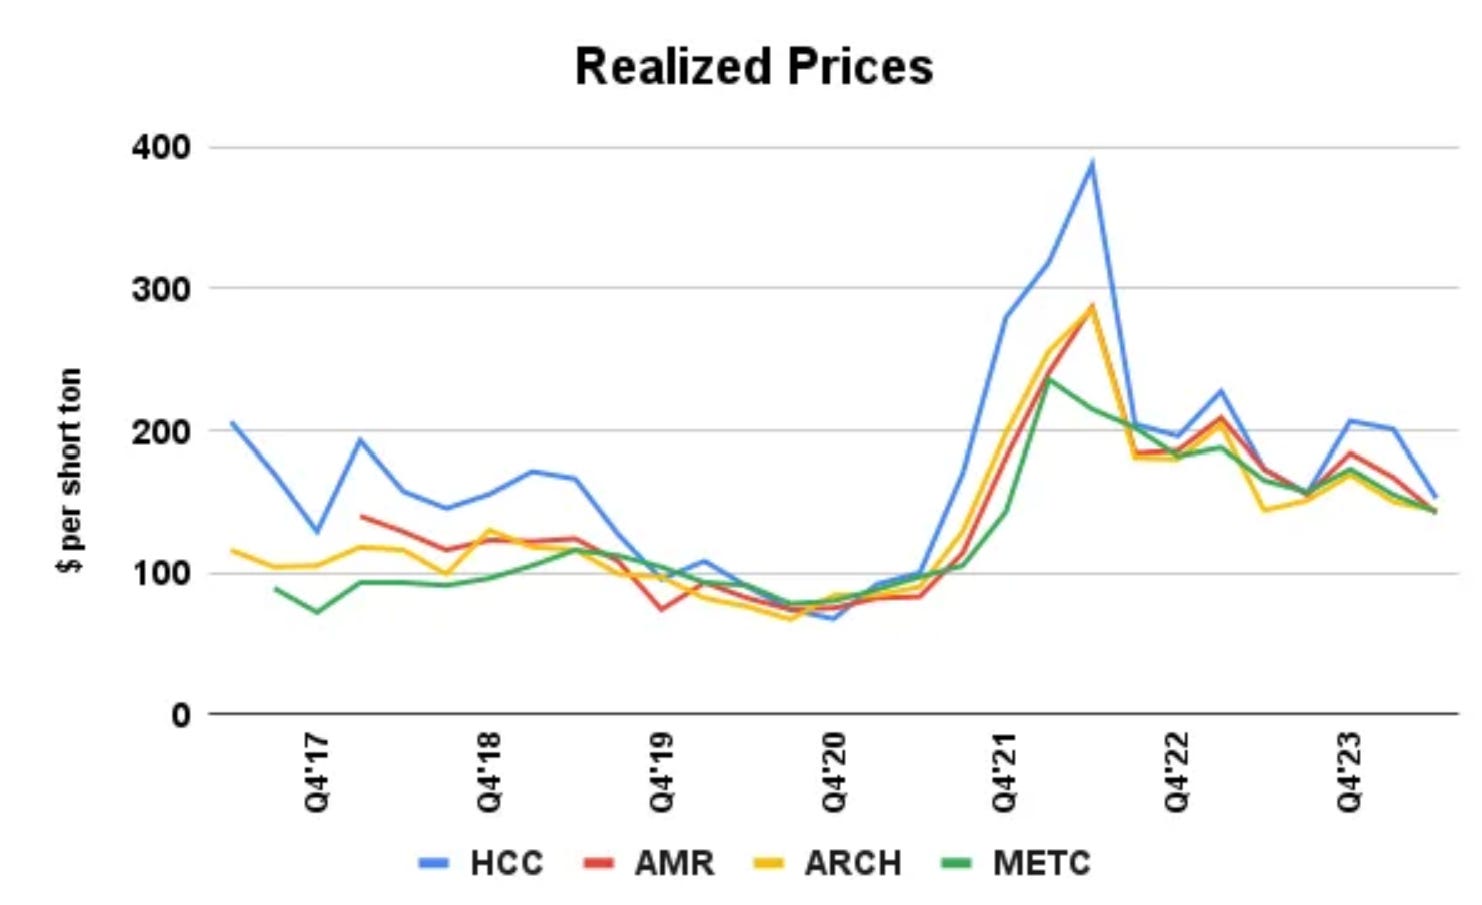
2) Higher realisation rates than peers (Pricing Power)
Even though warrior met coal operates in the commodities industry, it has a higher degree of pricing power compared to its peers due to the product mix. Going back to the 4 different types of met coal:
Coking Coal
Hard Coking Coal (HCC)
Semi-soft Coking Coal (SSCC)
Pulverized Coal Injection (PCI) Coal
Out of these 4, the highest quality and the one that commands the highest pricing power is HCC which is what warrior met coal exclusively produces. HCC is used to produce the strongest and highest grade coke. It is the most critical and highest-quality component of the coke oven blend.The quality of the coke directly dictates the performance and productivity of the blast furnace. Steel grades that require the most rigorous purity, consistency, and structural integrity benefit most from the use of coke made from HCC as it produces coke with the lowest levels of impurities, such as sulfur and phosphorus. These elements are “enemies” in steelmaking, as they can weaken the final product or complicate the alloying process. HCC is a product that is indispensable and is the backbone of a coke blend that blends SSCC and PCI even for low quality steel products.
Warrior exclusively produces HCC and hence enables them to have significant pricing power compared to its peers in both boom and bust periods. During the 2022 boom, Warrior’s realisation rate was 108% of the SPGI Platts Index compared to its peer 85%. Currently this realisation rate is 83% for warrior met coal and 67% for its peers (AMR).
The combination of a high pricing power together with a low FOB cost distinguishes warrior met coal from its competitors.
Met Coal Price Outlook
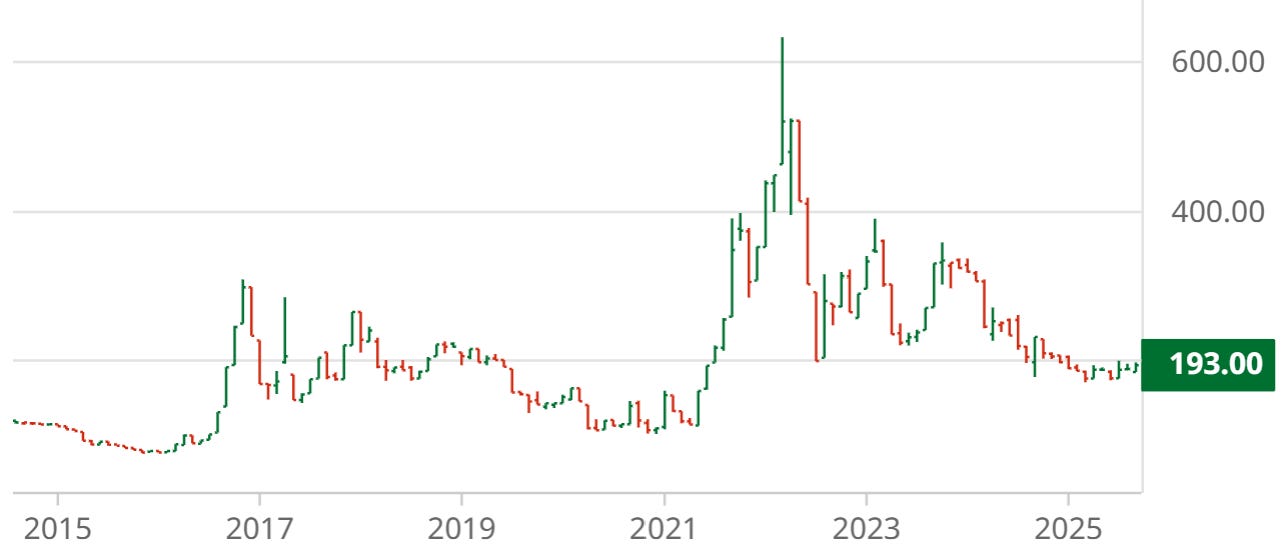
In order to forecast the future profits of warrior met coal, we will have to also forecast the price of the underlying commodity-metallurgical coal.
As we can see from the chart for met coal prices, met coal goes through periods of booms and busts. These booms and busts in the past are driven by 2 things: demand as well as supply for met coal.
Let’s go through some notable periods of busts in the recent decade and the reasons why:
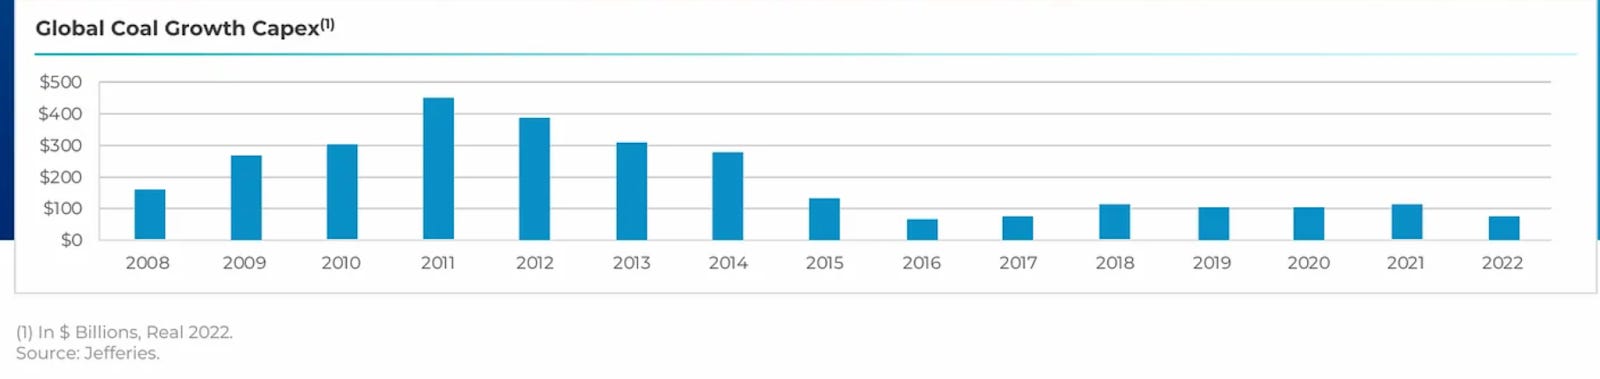
2015: Met coal prices declined 70% from peak as there was a large influx in the supply of met coal due to heavy capex in the industry from 2011-2012.
2020: Covid induced bust. Demand for steel fell to historical lows as there were limited infrastructure buildout.
Based on the global growth capex, we can see that we are currently in a supply constrained period as global capex has remained flat despite a sharp spike in met coal prices in 2022 mainly due to ESG regulations & banks not willing to finance such mine expansions. Hence the likelihood of a supply induced bust is highly unlikely.
Now lets move on to analyse the future demand.
Future demand will be driven by infrastructure buildout and it is highly likely to come from SEA and India. These regions are underdeveloped and have significant plans to increase their infrastructure buildout. Urbanisation trends and increase in SOL will provide a secular tailwind for the demand for met coal.
90th Cost Percentile
In the commodities industry there is a concept known as the 90th cost percentile.
The 90th cost percentile represents the production cost of the producer that is cheaper than only 10% of the industry but more expensive than 90%. In commodity markets like metallurgical coal, it often serves as a price floor because if prices fall below this level, the highest-cost 10% of supply becomes unprofitable and shuts down. Supply reductions then push prices back up.
Over the past 20 years. The only times where met coal prices broke below the 90th cost percentile for a sustained duration of time was in 2015 (supply induced) and 2020(Covid Induced) both of which are unlikely to occur again. The current 90th cost percentile is at USD190/Mt signalling that we are potentially at a bottom for met coal prices.
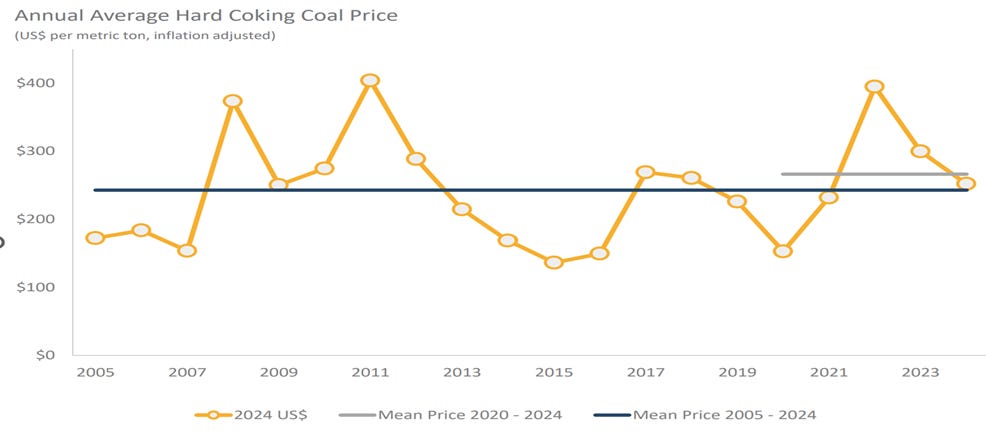
Another indicator of the bottoming of met coal prices & normalisation is likely to occur is the fact that across 20 years, the inflation adjusted price of met coal is USD260/Mt indicating that we are currently in a down cycle and prices are likely to normalise in the future.
To determine our worst case scenario we will take Covid-19 lowest price of 108 and inflation adjust it to the present, the lowest that met coal prices could reach in the event of another large scale pandemic will be USD134/Mt.
We can safely assume that there is almost a 0 probability of such calamity occurring again.
In my model, I will assume the following for met coal realization rates for HCC:
Best:240USD/Mt
Base:200USD/Mt
Bear:160USD/Mt
These assumptions are already very conservative and ignore the potential of a boom in met coal prices. The best case assumes a normalisation to the mean.
Blue Creek (Key Value Driver)
We will now move on to Blue Creek(BC) the newest mine that Warrior is developing.
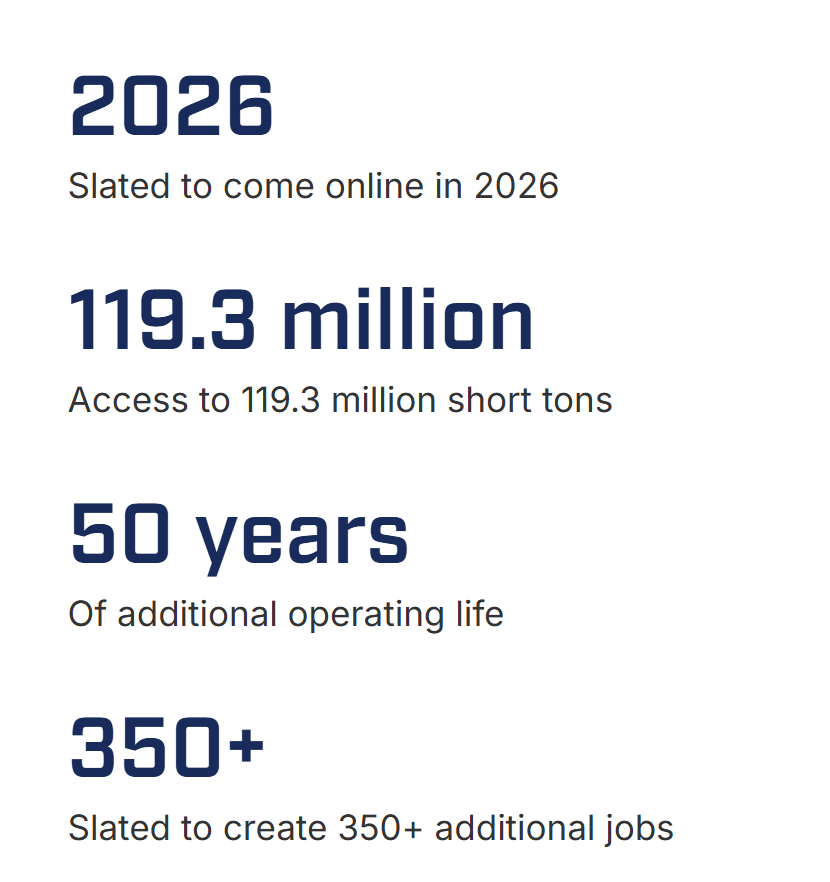
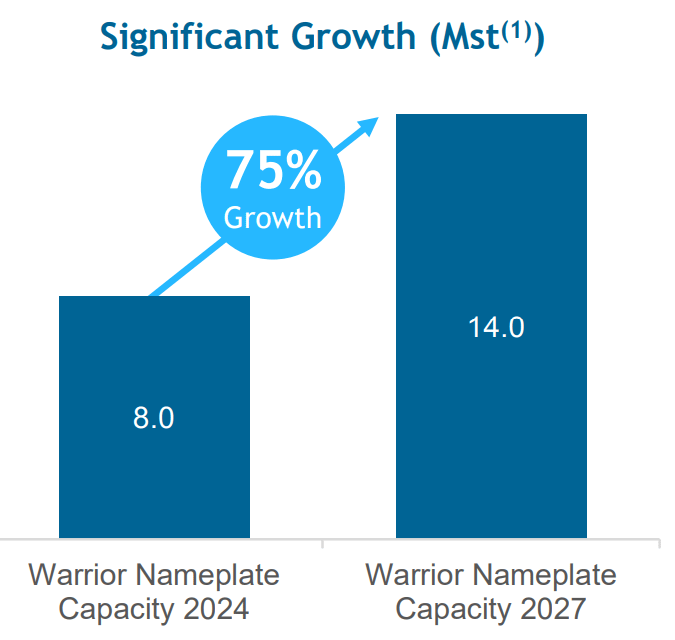
Over the past few years, the company has put in close to 1B in capex to develop the blue creek mine which is slated to begin production in 2026 Q1. BC is expected to increase the volume of the company by 75% from 8.2 mill St to 14mill St with a potential to further expand production during booms to 15 mill St with $21 million of additional capex and 40 additional workers based on management’s guidance. Blue creek is also expected to strengthen the moat of the company with the FOB cost of BC being only USD90/St compared to the current USD115/St under normalised Met Coal prices.
BC itself is expected to generate 482 mill in FCF assuming a met coal price of 200/mt. The NPV of BC itself is estimated to be 5.4B based on an assumed metallurgical coal price of $250 per metric tonne ($233 per metric tonne realized HVA price), an ~40 year mine life, 8.2% real discount rate(after-tax). Assumes 15% cash tax rate.
Just a reminder that the market cap of HCC is 3.2B and BC, just one of the 3 mines it owns is expected to be worth 5.4B.
Whilst there is a risk that the project will be delayed or run over budget, it is highly unlikely as the management in Q3 just shifted forward their guidance of completion from Q2 to Q1 of 2026.
With BC completion finished. The capex of HCC will decrease immediately by 250 million, creating free cash flow. The combination of a stop in BC capex and BC increasing production volume will cause the FCF of HCC to spike significantly.
Though it is possible that BC may be delayed and/or increase in capex, it is highly unlikely as management recently pulled forward the timeline that bluecreek finishes completion.
Capital Appreciation Is Not The Only Way To Generate Returns
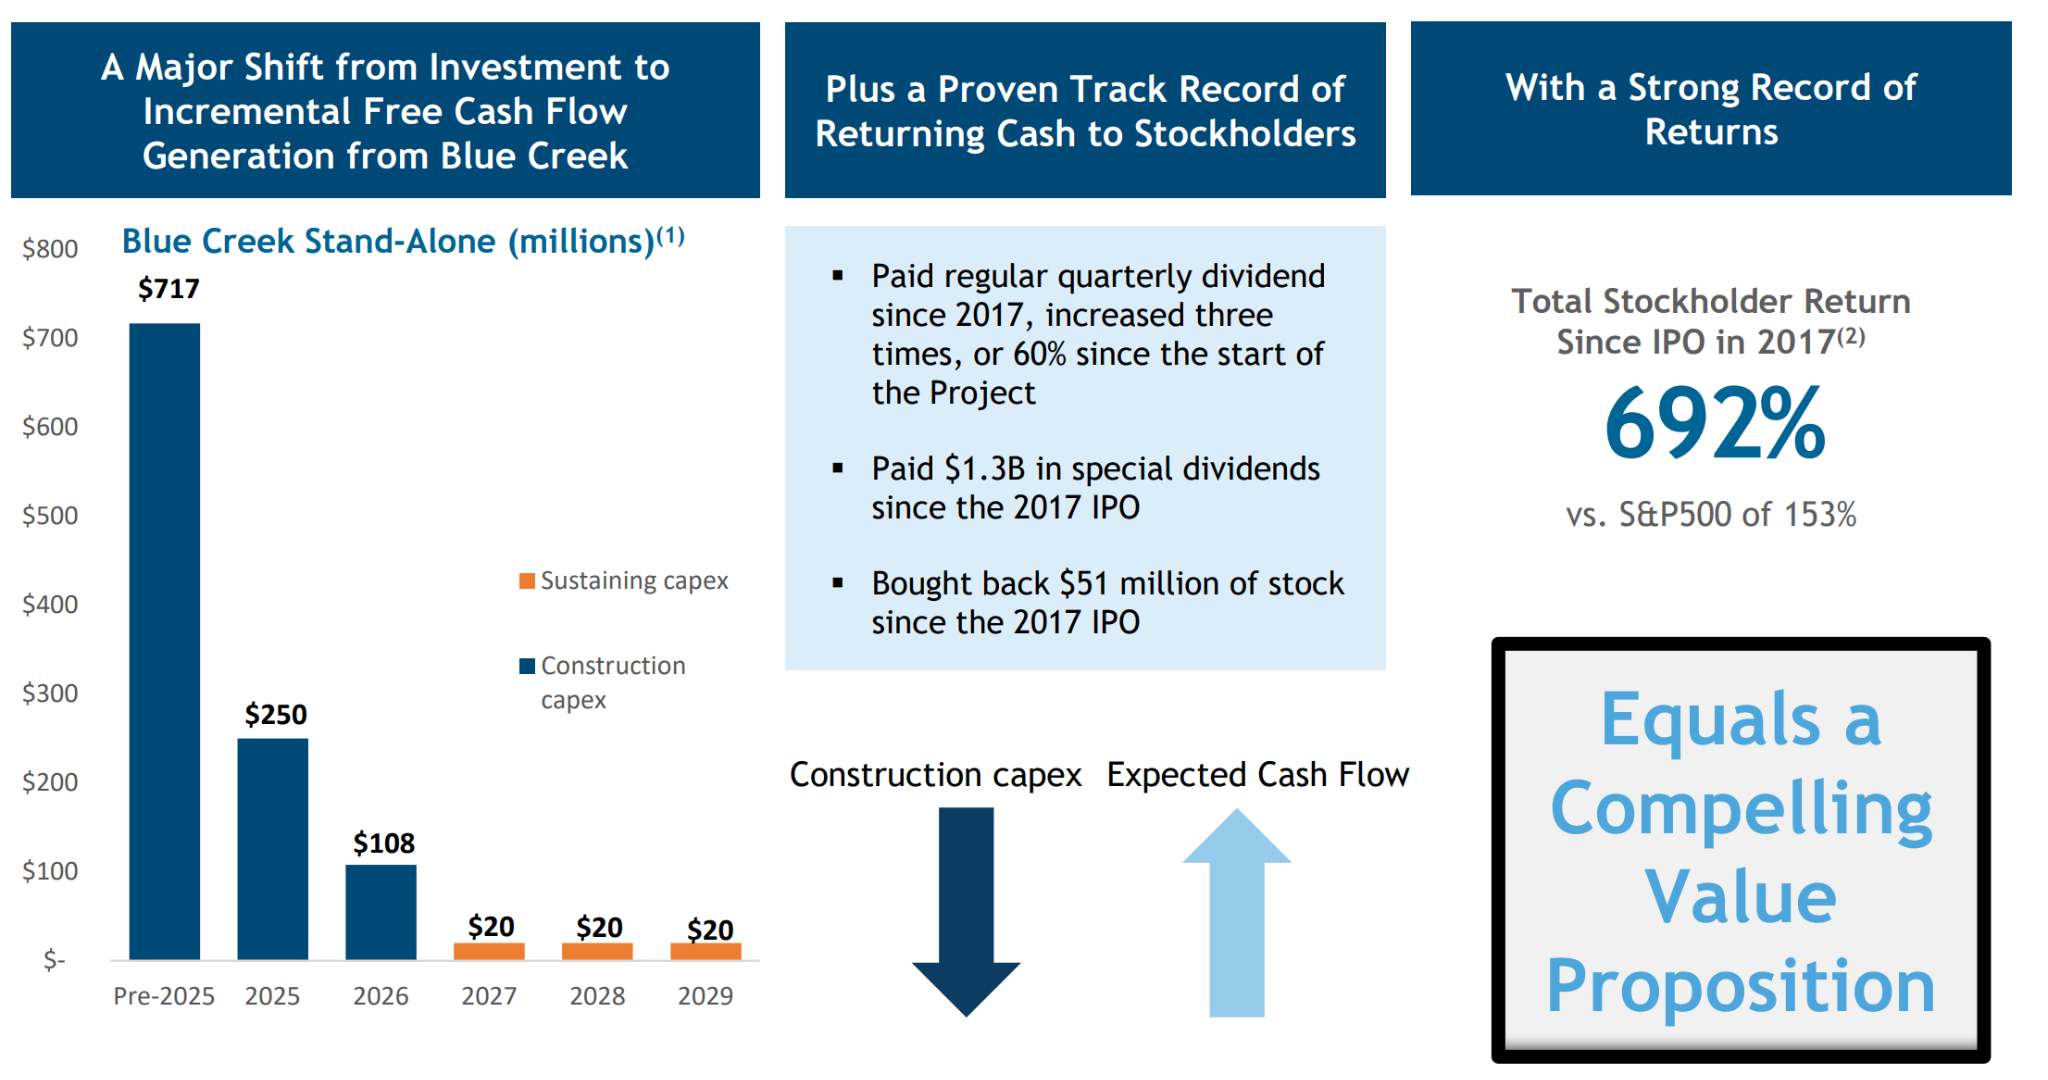
Since inception, Warrior Met Coal has a consistent track record of returning cash to its shareholders via dividends especially during periods where there is a met coal boom. Since 2017, the company returned 1.3B in special dividends to its shareholders with the majority of it coming in 2017 alone. During the 2022 met coal boom, Warrior funneled its cash flow to the construction of blue creek mine instead of returning it to its shareholders via dividends. With blue creek finishing completion, I believe that warrior met coal will start returning their excess free cash flow to their shareholders via dividends or replicate its competitor AMR’s stock buybacks.
Valuation
To value the company, I will use 2 approaches
A discounted cash flow approach
Annuity approach
Discounted Cash Flow
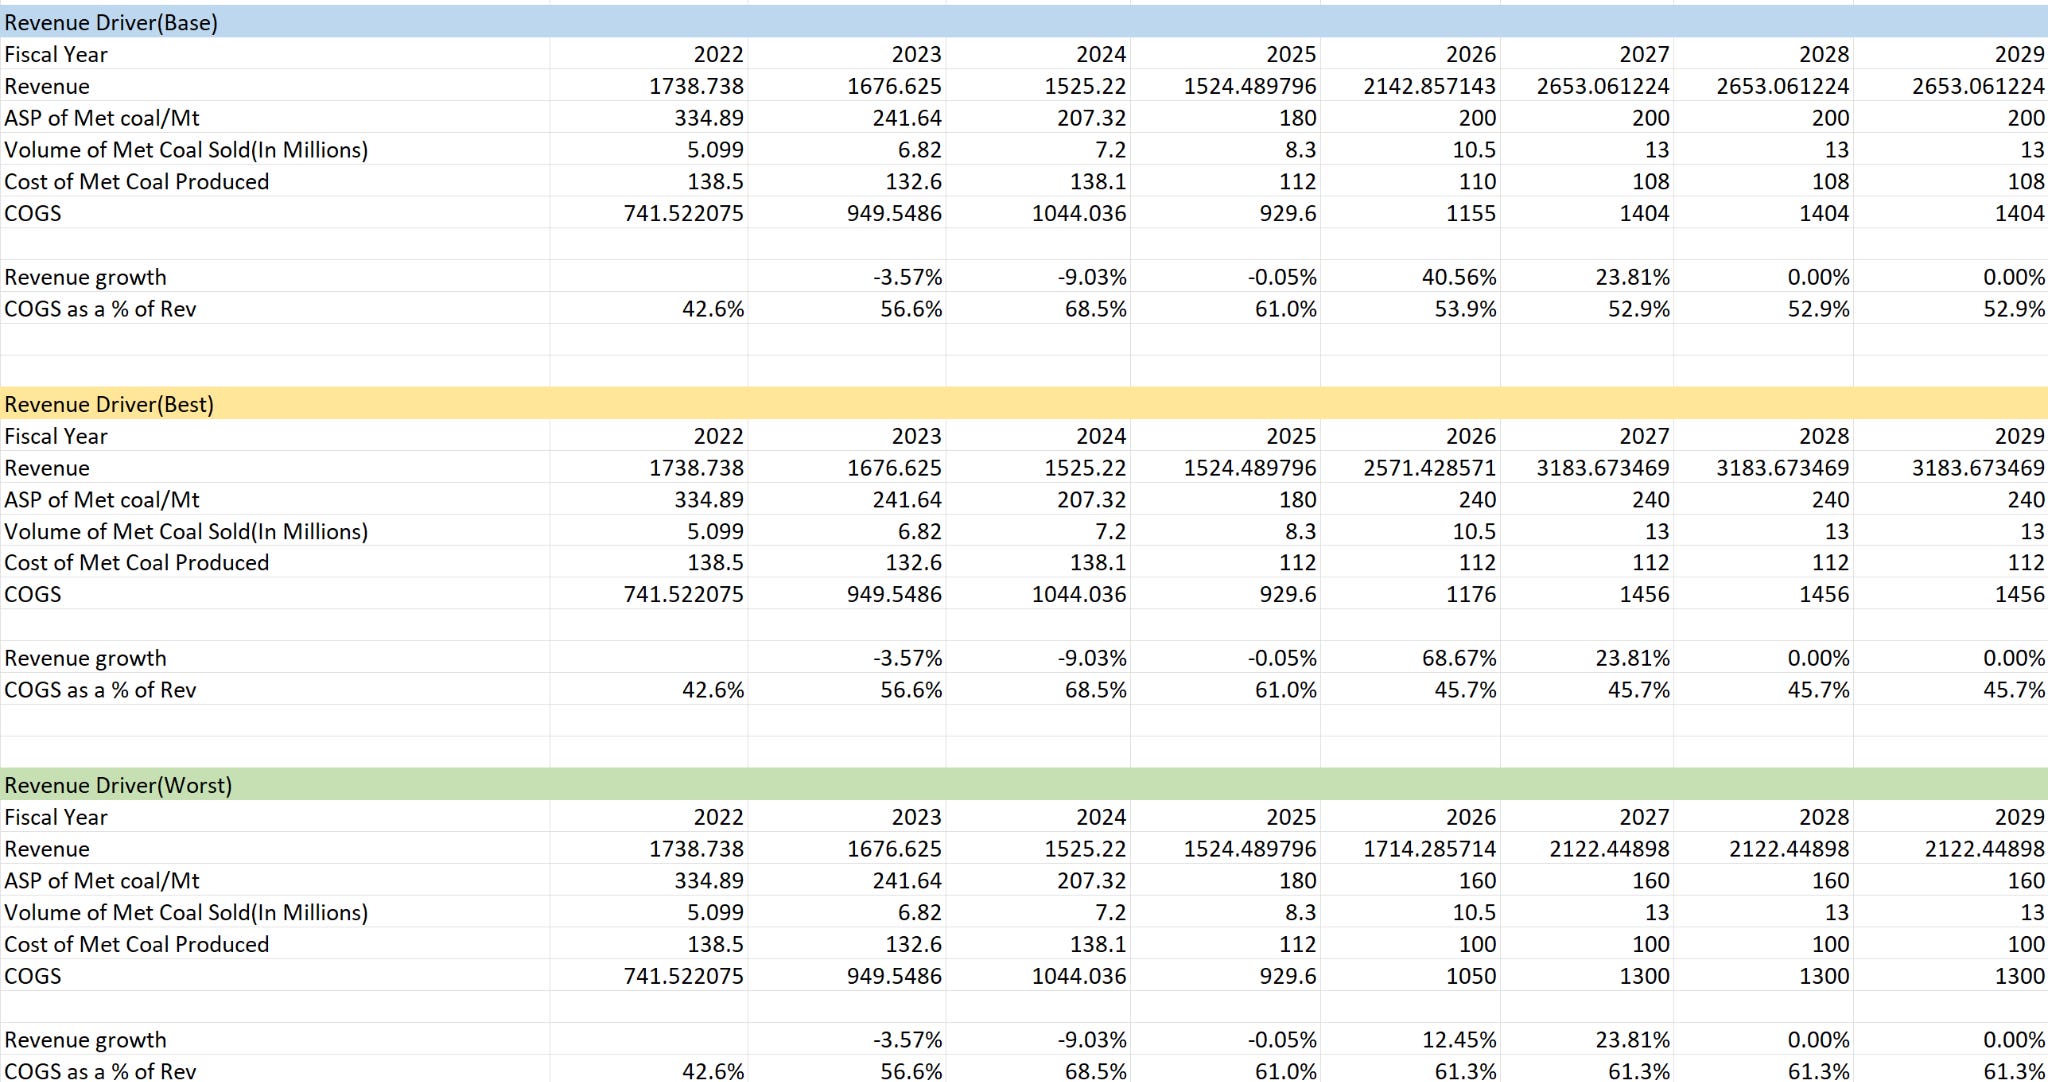
These are the possible met coal price scenarios that I have used for Warrior:
Best: 240USD/Mt
Base: 200USD/Mt
Bear: 160USD/Mt
Warrior Met Coal’s Blue Creek Mine will lead to a sharp drop in the cost of met coal produced and we can see some of its effects in 2025 as blue creek has started producing some coal from its mines. The impact will be much greater from 2026 onwards as blue creek reaches full operations then. The full capacity for Warrior will be 13 Million Tons (14 Million Short Tons).
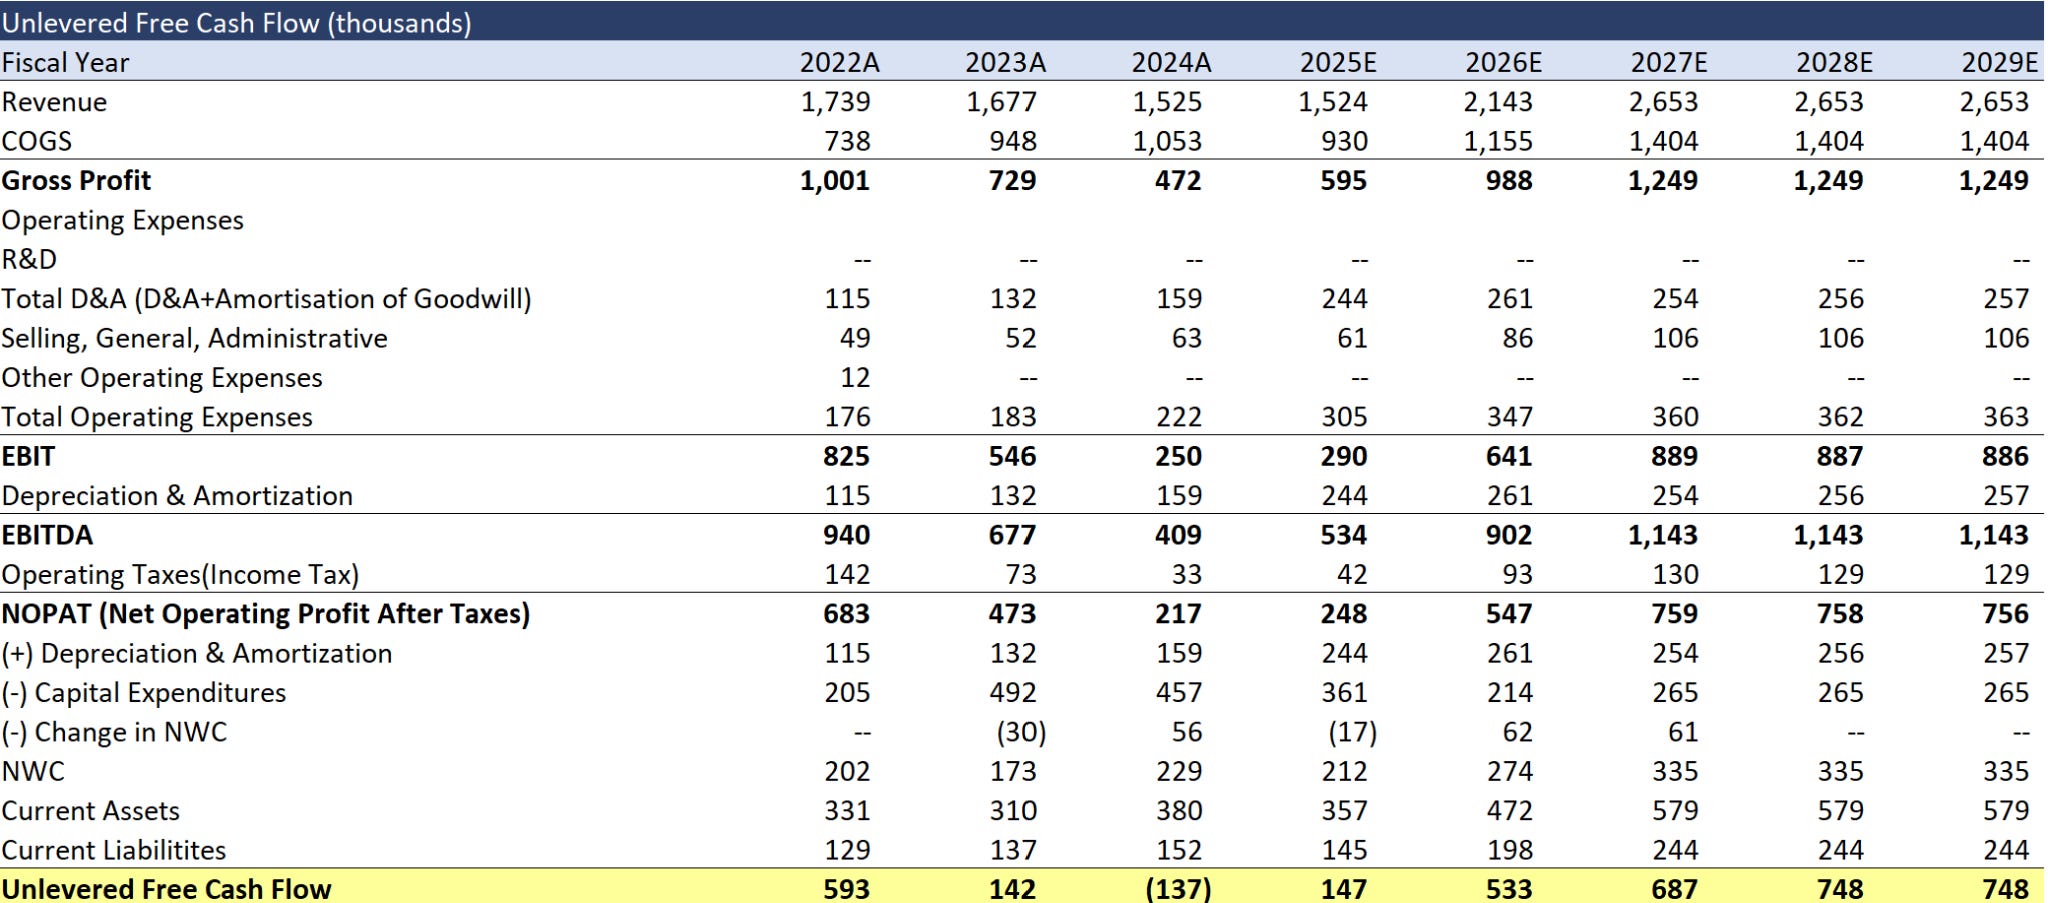
Free cash flow of warrior met coal is expected to increase significantly driven by 2 things:
Decrease in capital expenditures (361 million to 214 million) due to the completion of blue creek mine
Increase in production volume and reduction in FOB costs leading to higher operating margins
Above is the expected FCF to be generated in the base case scenario.
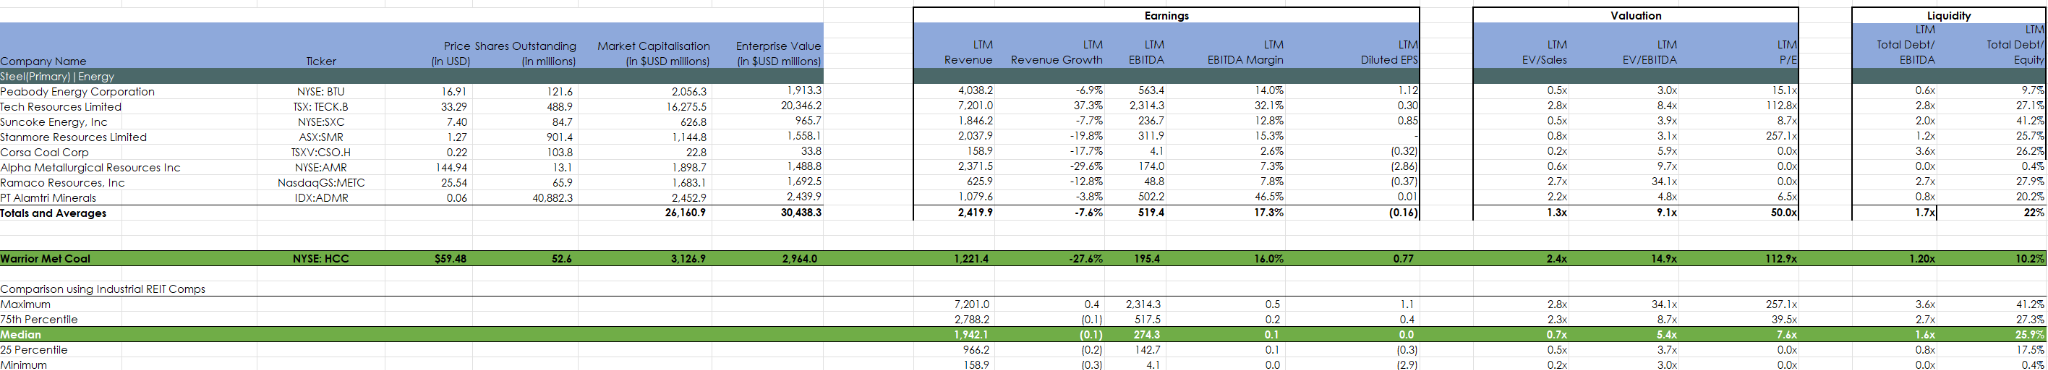
Utilised an exit multiple derived from competitors in the industry as well as the gordon growth model. In my opinion the GGM is not a good representation as the growth rate and the free cash flow that can be generated by the company is limited to the mine reserves which causes it to have a limited mine life of 17 years. Hence a better way of valuation would be the exit multiple approach which I will be focusing on.
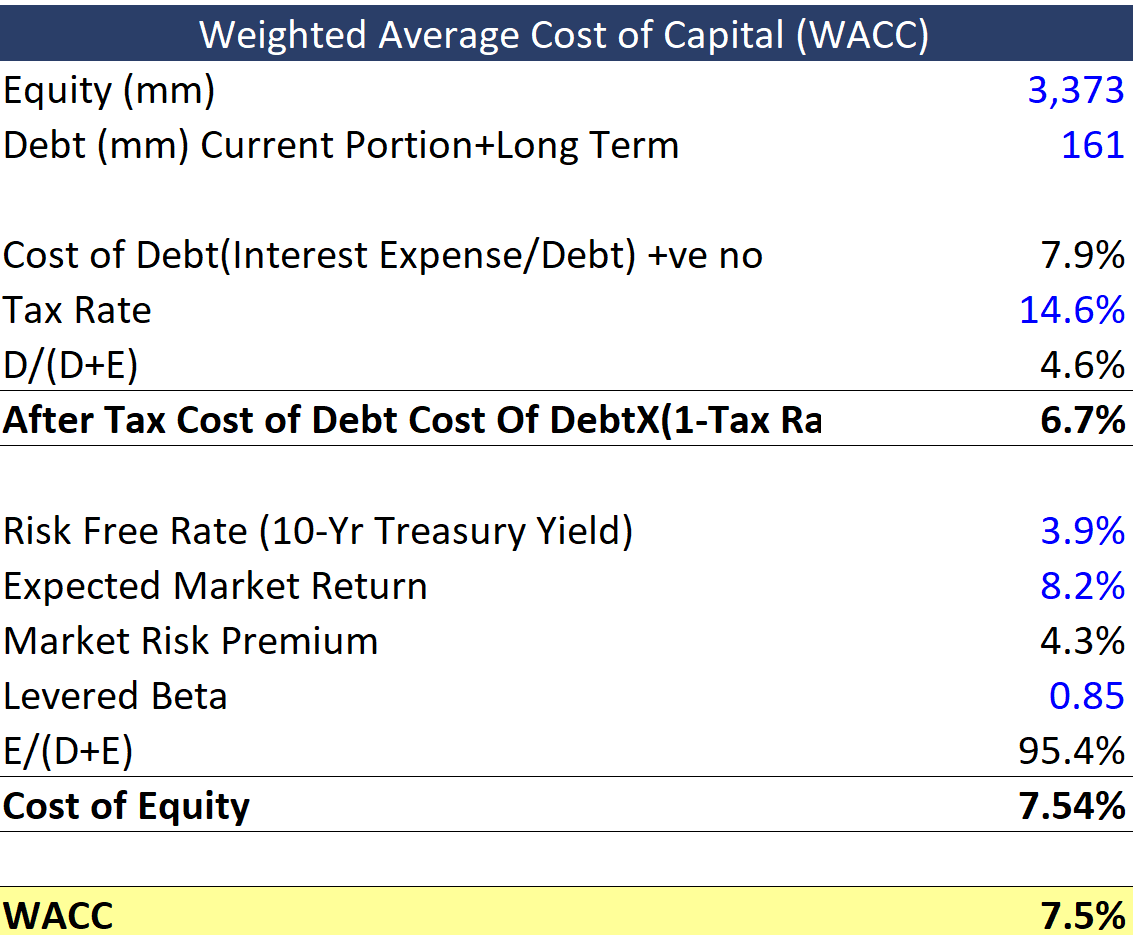
Warrior met coal has close to 0 debt and its stock price has a low beta which leads to a relatively low WACC.
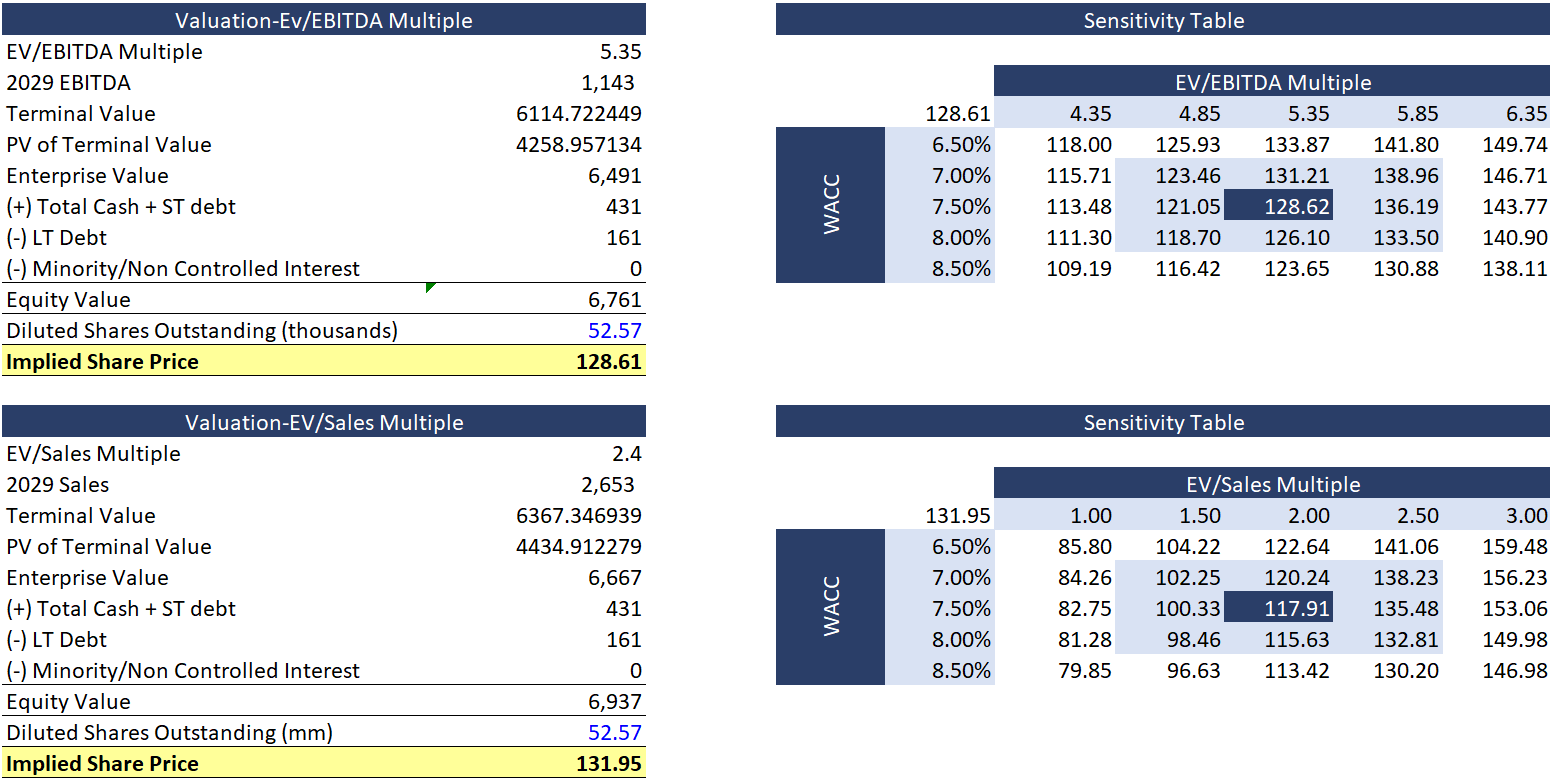
Base:
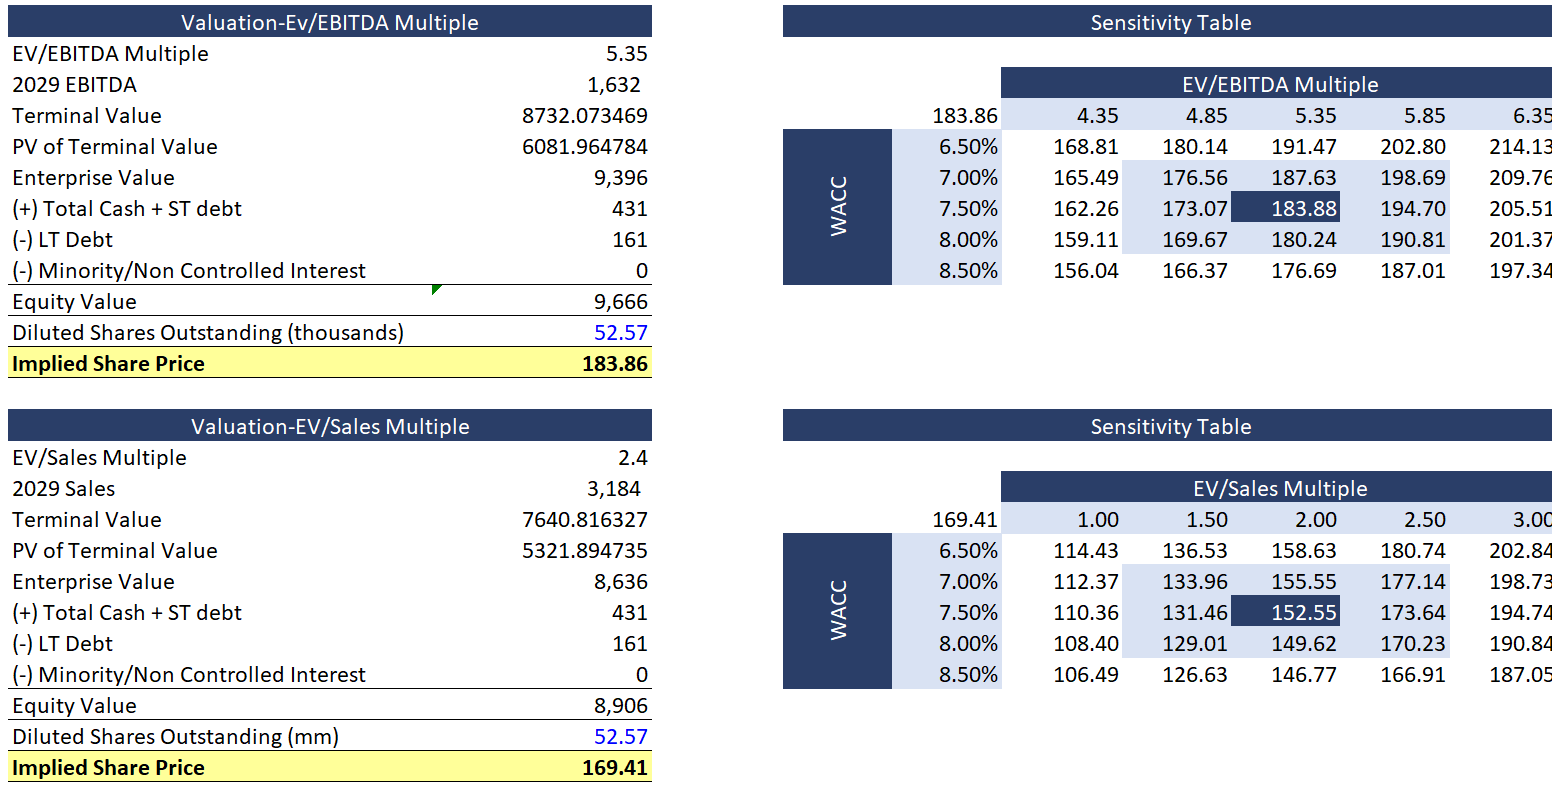
Best Case:
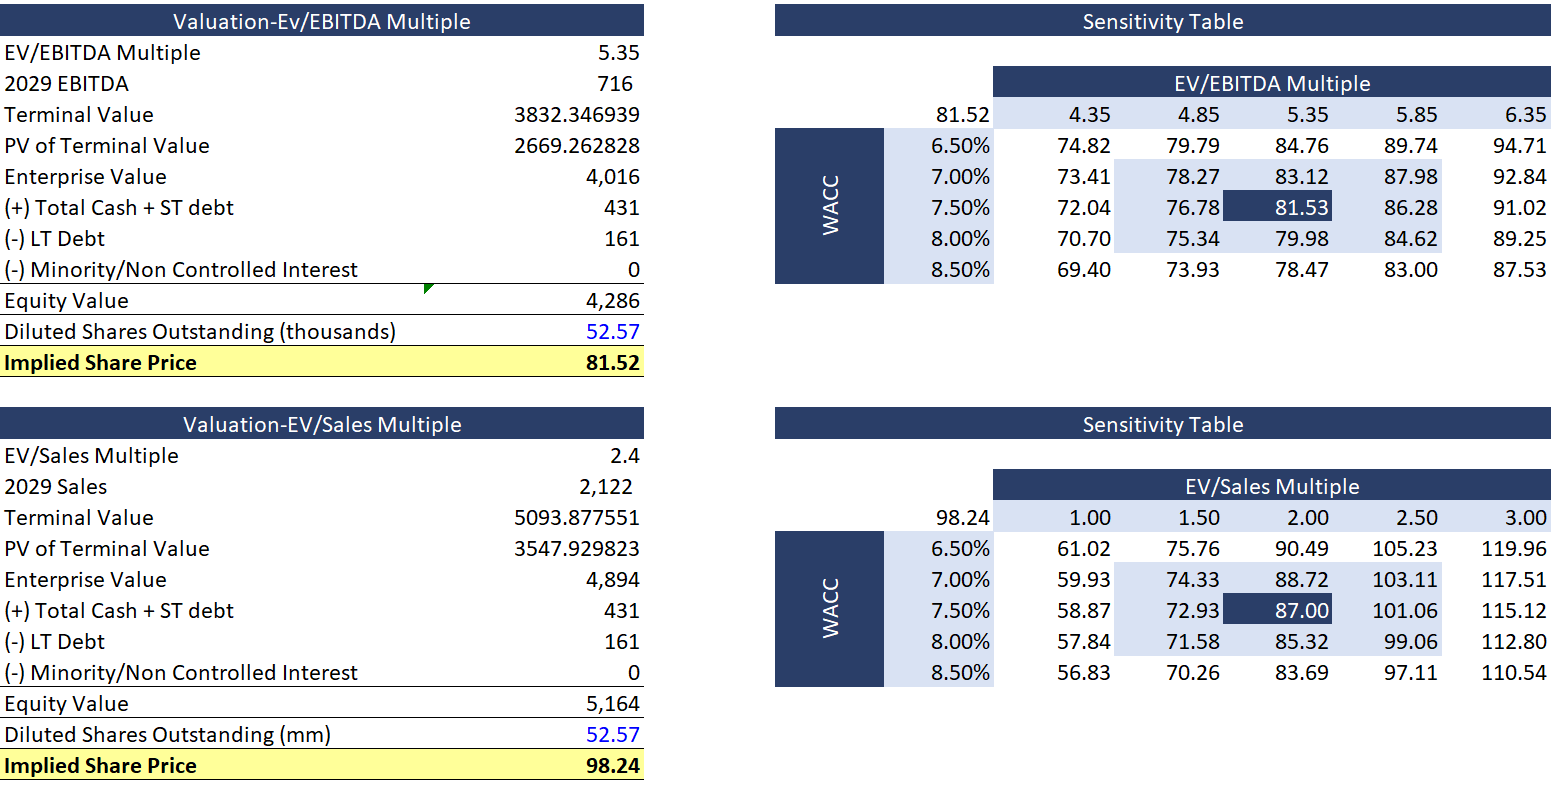
Worst Case:
Do note that all of these are valuations that have included management’s forecasts of blue creek production volume as well as fob costs. Should there be significant changes to management’s forecasts of FOB prices, production volume or unexpected increases in the capex for blue creek, it will significantly affect the free cash flow of the company and will lead to a lower valuation. The markets are currently not fully pricing in the expected benefits of blue creek simply due to the fact that most mining companies overrun their capex expenditures or delay their projects. However, I believe that Warrior will not face these issues simply due to the fact that the management has a consistent track record of setting and hitting their goals. Walter Scheller has been running Warrior within now bankrupt Walter Energy Group since 2011 and since Warrior went public, under Walter’s leadership the company has consistently met their management’s forecast over the past 10 years with management tending to underpromise and overdeliver.
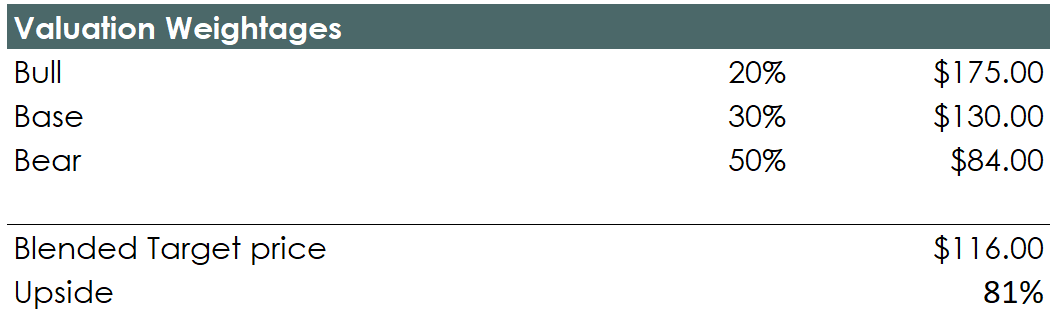
Combining all of the scenarios together we will get a fair value of 116 which assumes that the blue creek project is completed with no hiccups.
Annuity approach
To use the annuity approach, I will take the total mineable reserves across the mines for warrior and divide it by the annual production rate. As of now the mineable reserves across the mines are as such:
BC:119.3 Mt
Mine 4+7:100.5 Mt
Combined they will have 219.8 Mt
Assuming that their annual production volume remains at 13 Mt a year it will take 17 years for the mines to be depleted. Assuming across these 17 years the inflation adjusted realised met coal price is 200USD/Mt and the FOB costs remains at USD108/Mt.
Warrior met coal will be able to print 2.6B in revenue.
Assuming the FCF margin of the company remains at the base case scenario as seen in my model above, we will get a FCF of 600B a year.
Using the annuity calculation with a 10% discount rate we will get a NPV of Warrior to be 4.81B which implies a stock price of $91.50 as the base case scenario.
Notes From Author
I have initiated a postion in Warrior Met Coal at $43 earlier this year and my views of the company has not changed and I am still holding on to the positions that I have (now representing close to 8% of my portfolio post appreciation). Whilst I am confident in management’s ability to grow the intrinsic value of the company, there is a risk that Blue Creek is not as value accretive as the management projects.
I believe that the company is still significantly undervalued and still presents a much better opportunity than the rest of the market. With blue creek completion coming soon within the next 6 months, one should expect volatitlity in the markets and potential downside should blue creek get delayed.
Nice write up! But some numbers and assumptions seem totally off the mark. For example, HCC realized met coal price for Q3 2025 was $136/short ton or $150/metric ton. That’s much lower than what you are factoring in your bear case ($160).